goeBURST
global optimal eBURST
software tutorial
Open a file
Go to File > Open menu. Select at what level the Clonal Complexes (groups) should be defined (SLV, DLV or TLV) by clicking in the desired checkbox on the "Edge level to define group". Select the file to open (for a description of the correct file format or to load sample datasets click here)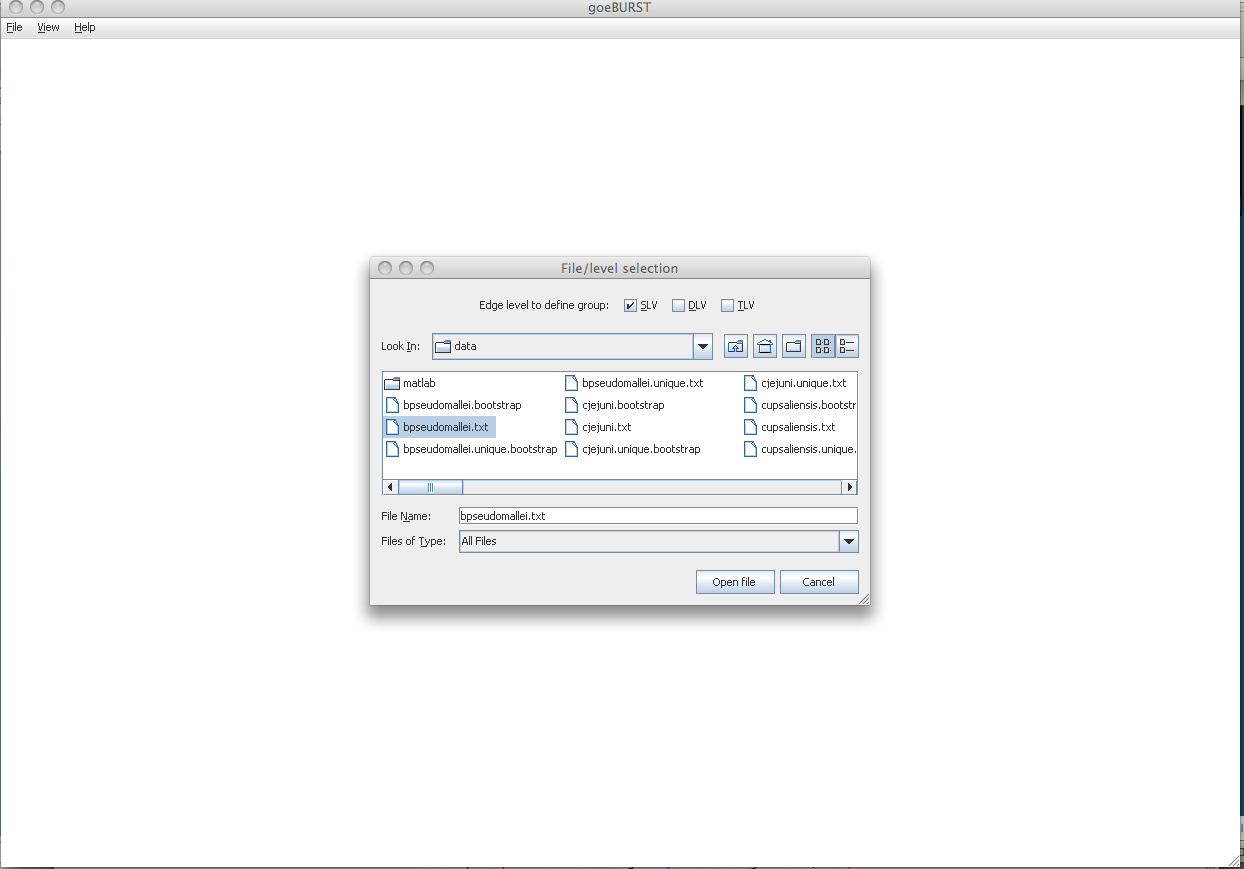
Select the desired file and click Open file
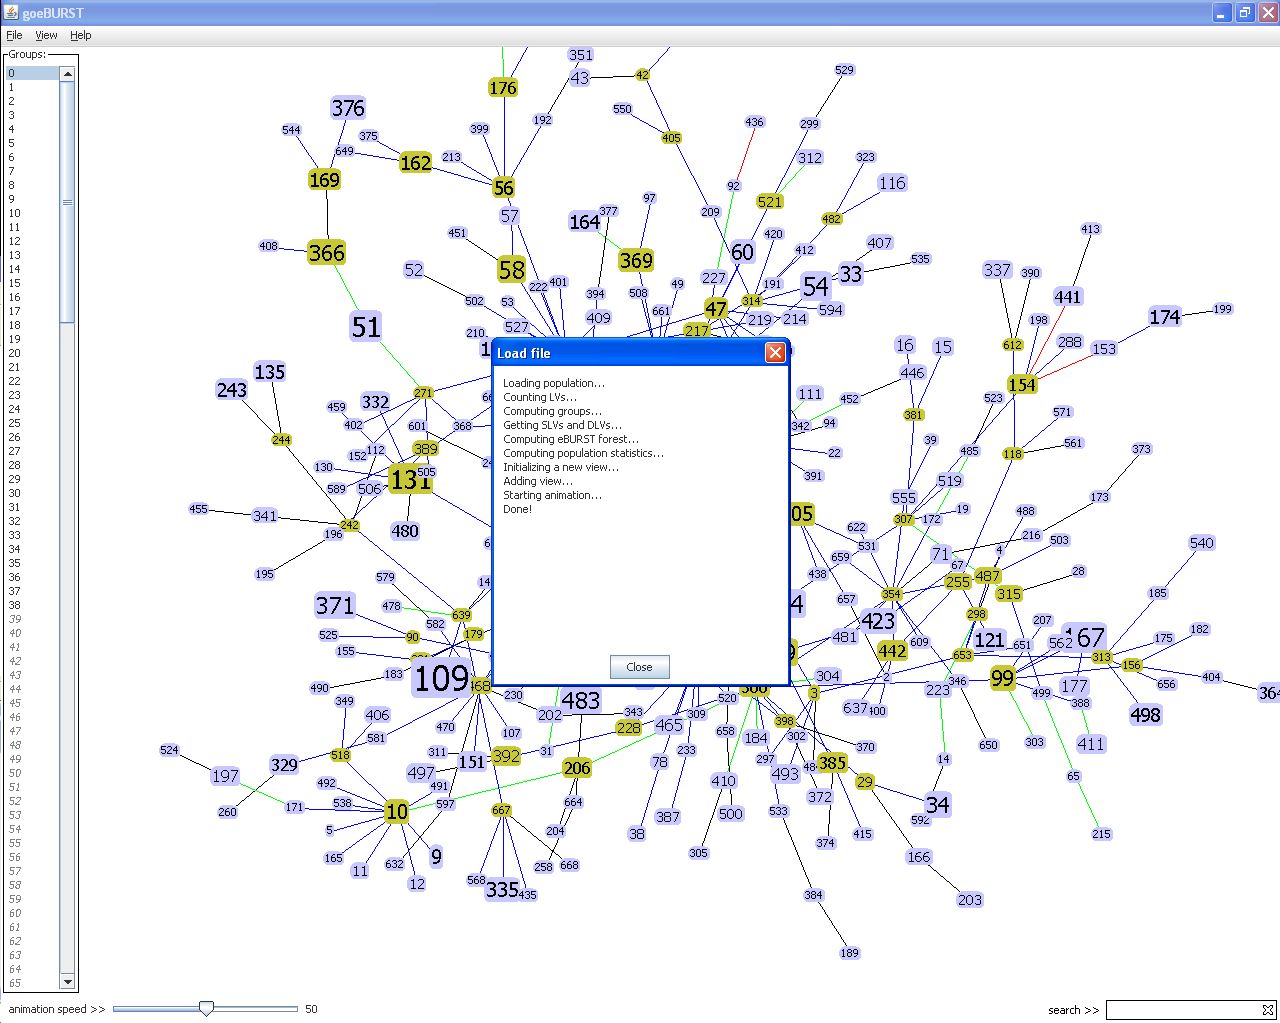
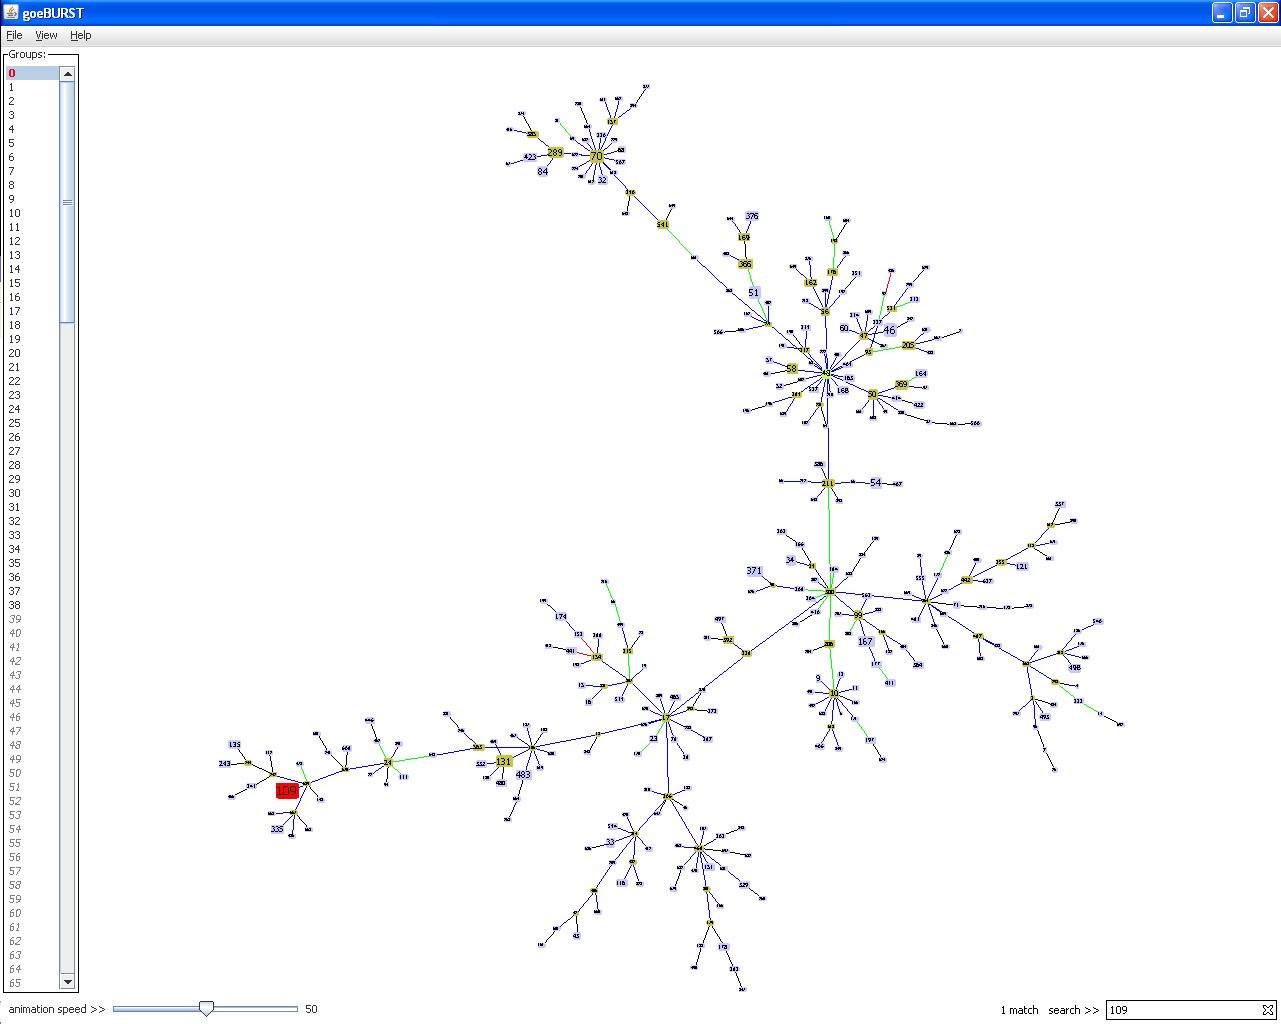
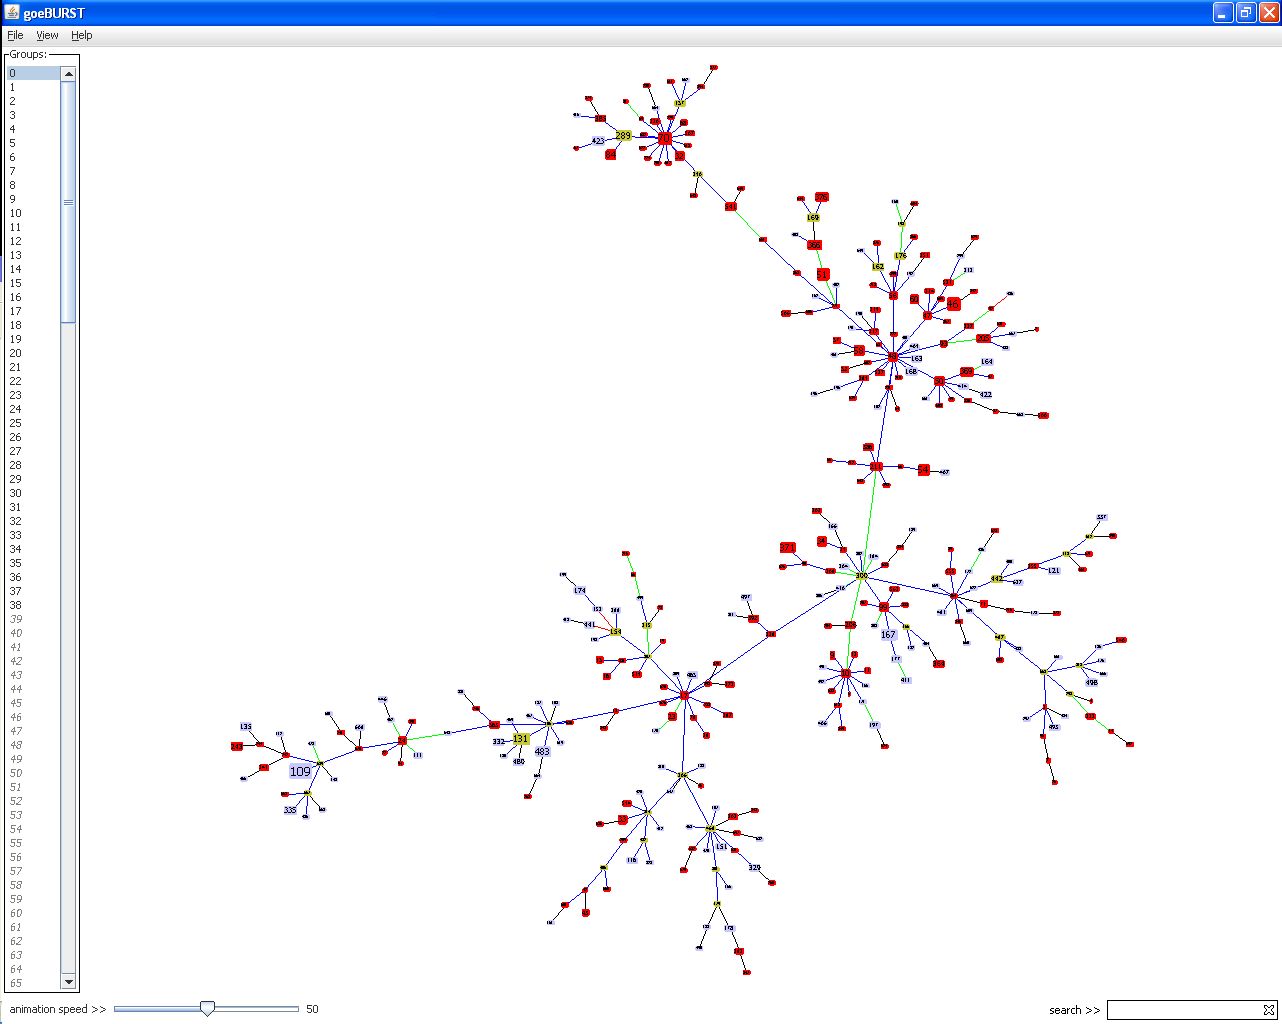
The program will show a progress report window that you can close when the program finishes loading the data file. You will notice that the program then tries to optimize the display of the group with the largest number of elements in the data set. You can change the speed at which this occurs by moving the slider on the bottom left of the program window.
Fit graph to window
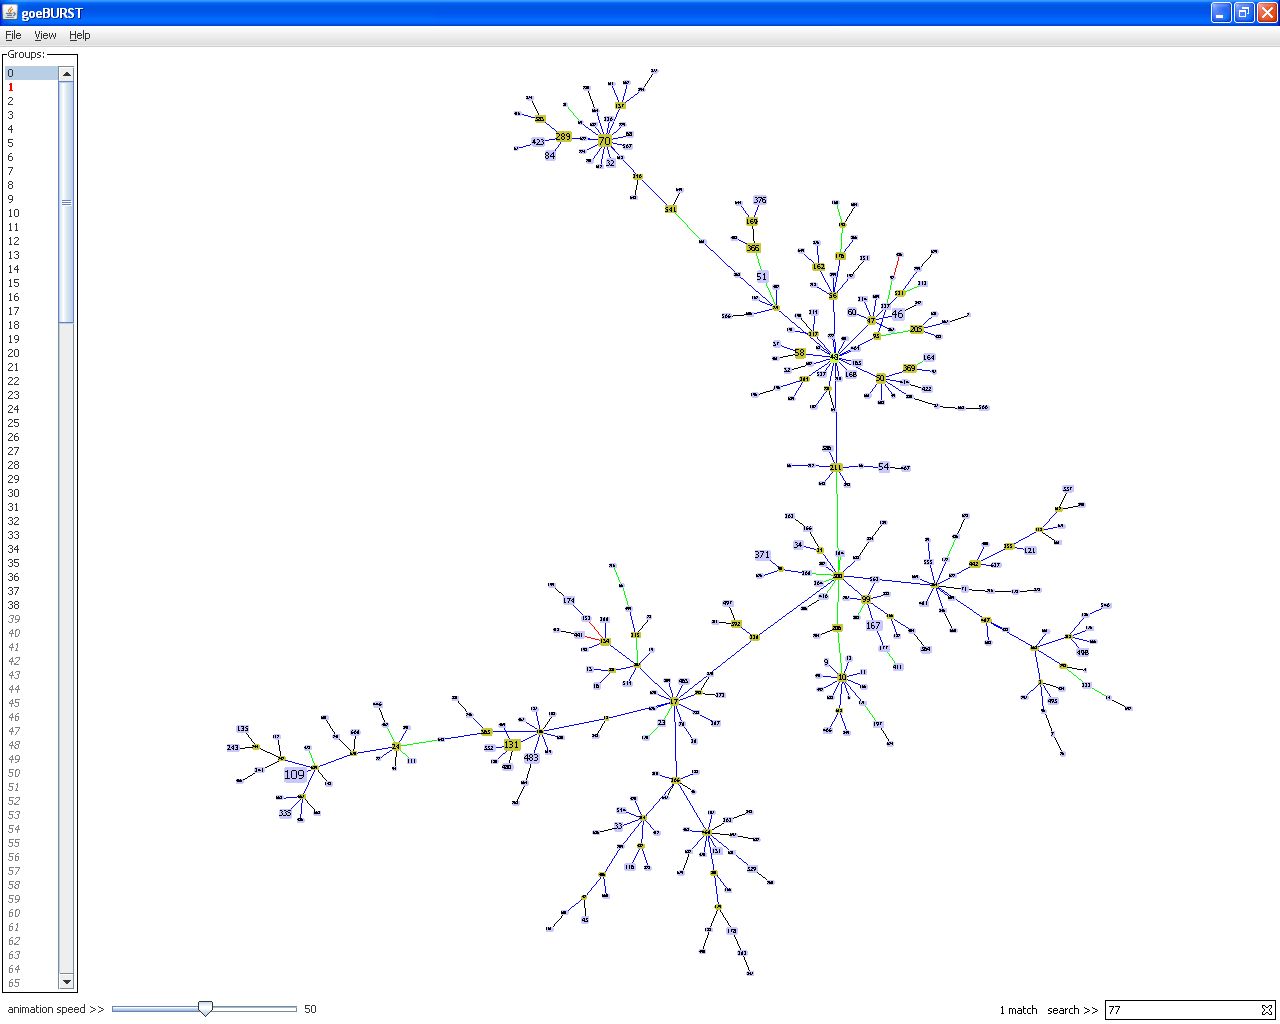
You can fit the graph of the first group to the window by right-clicking any open space (i.e. with no link or ST node) on the window.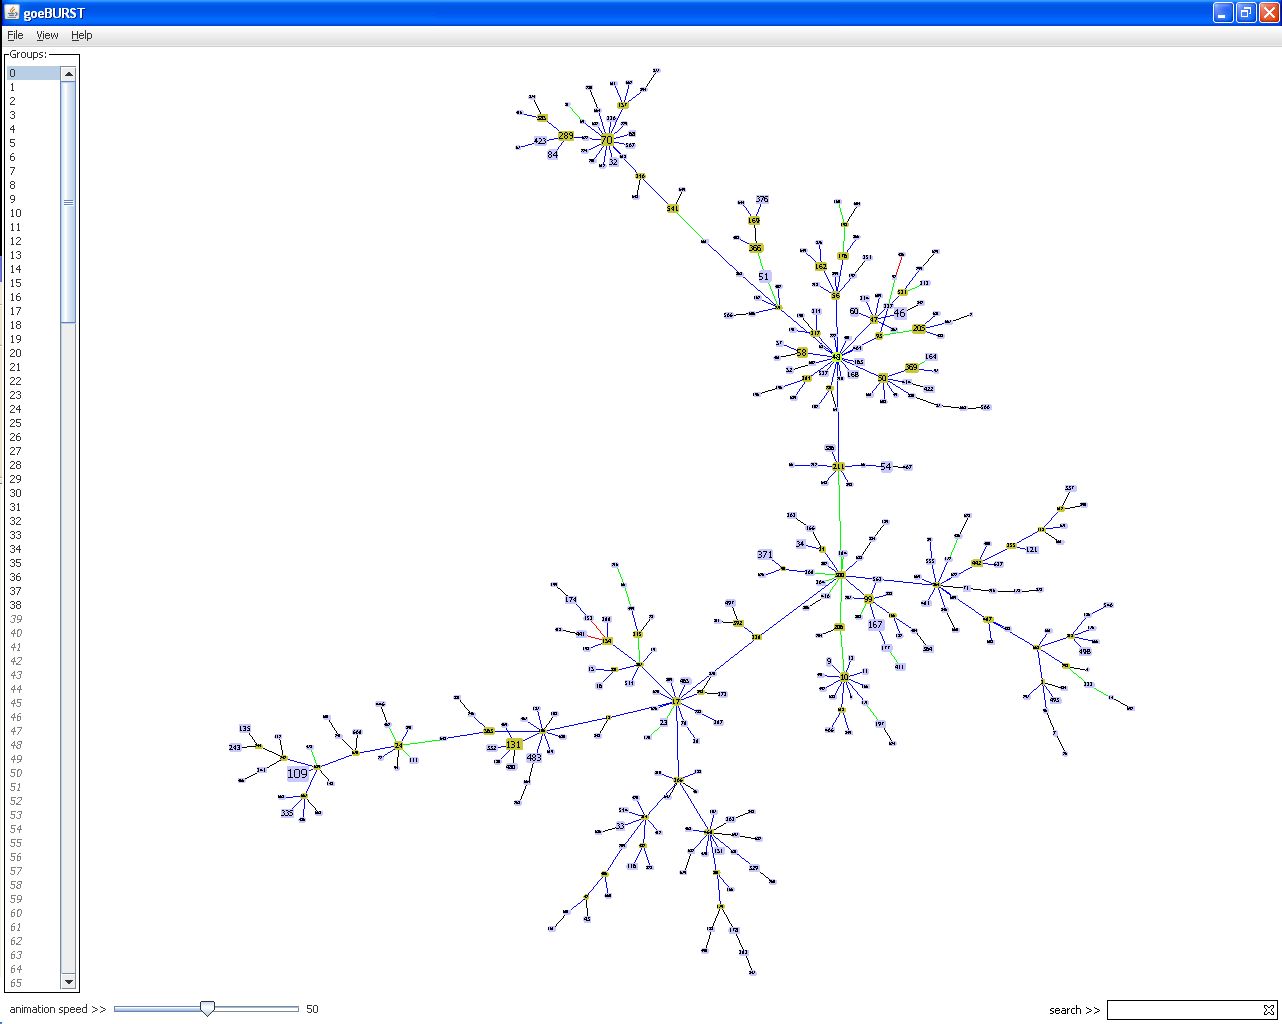
In this window the size of the elements reflect their abundance in the data set. The identified group founder is displayed in light green, the sub-group founders are represented in darker green and common nodes in blue (for more information see the included help or below).
If you are not happy with the way the graph is displayed you can manually alter it by clicking with the left mouse button on a node and dragging it.
Finding nodes
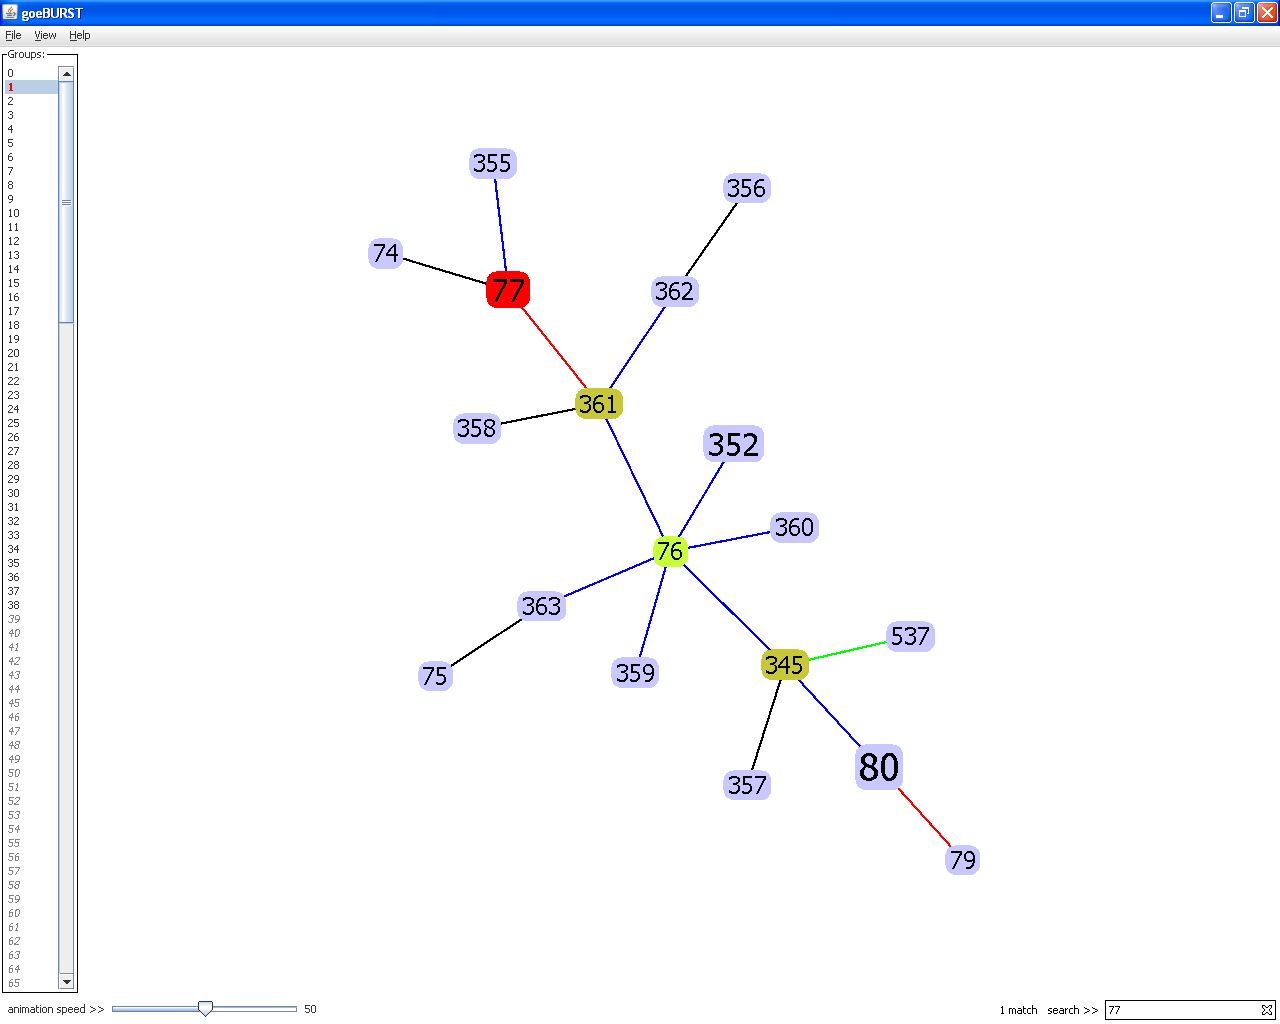
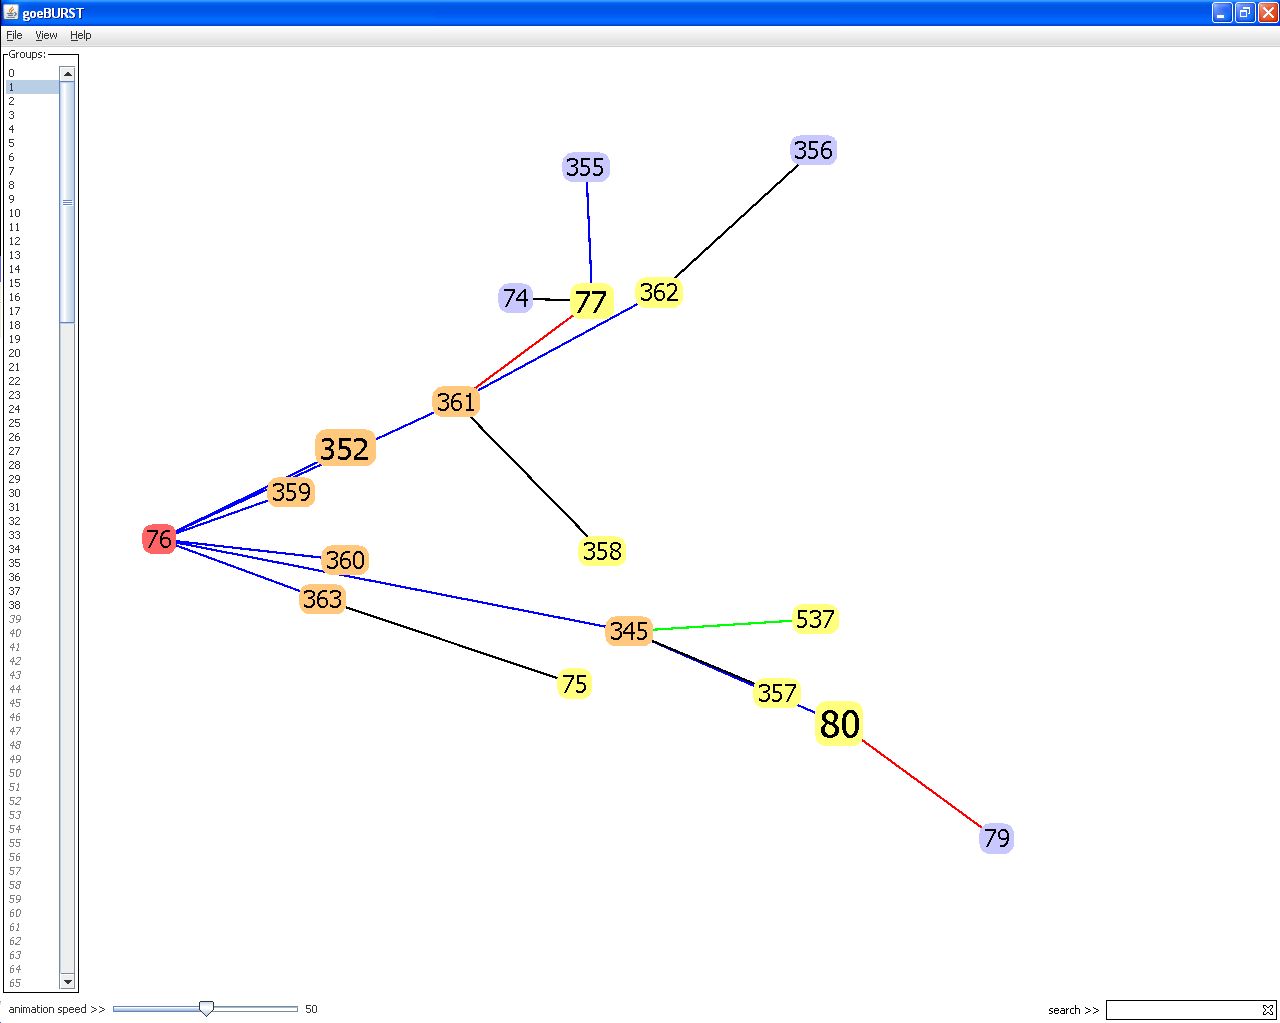
To find a specific node enter the node number (ST) in the box on the bottom right corner of the program window. If the ST is found in the currently displayed group it will be highlighted in red.
If the node is not found within the group displayed, the group where the node is
found is highlighted in red in the group panel.

You can then click on the group and again the searched ST will be highlighted in
red.
Color Conventions
The main window follows always the same conventions.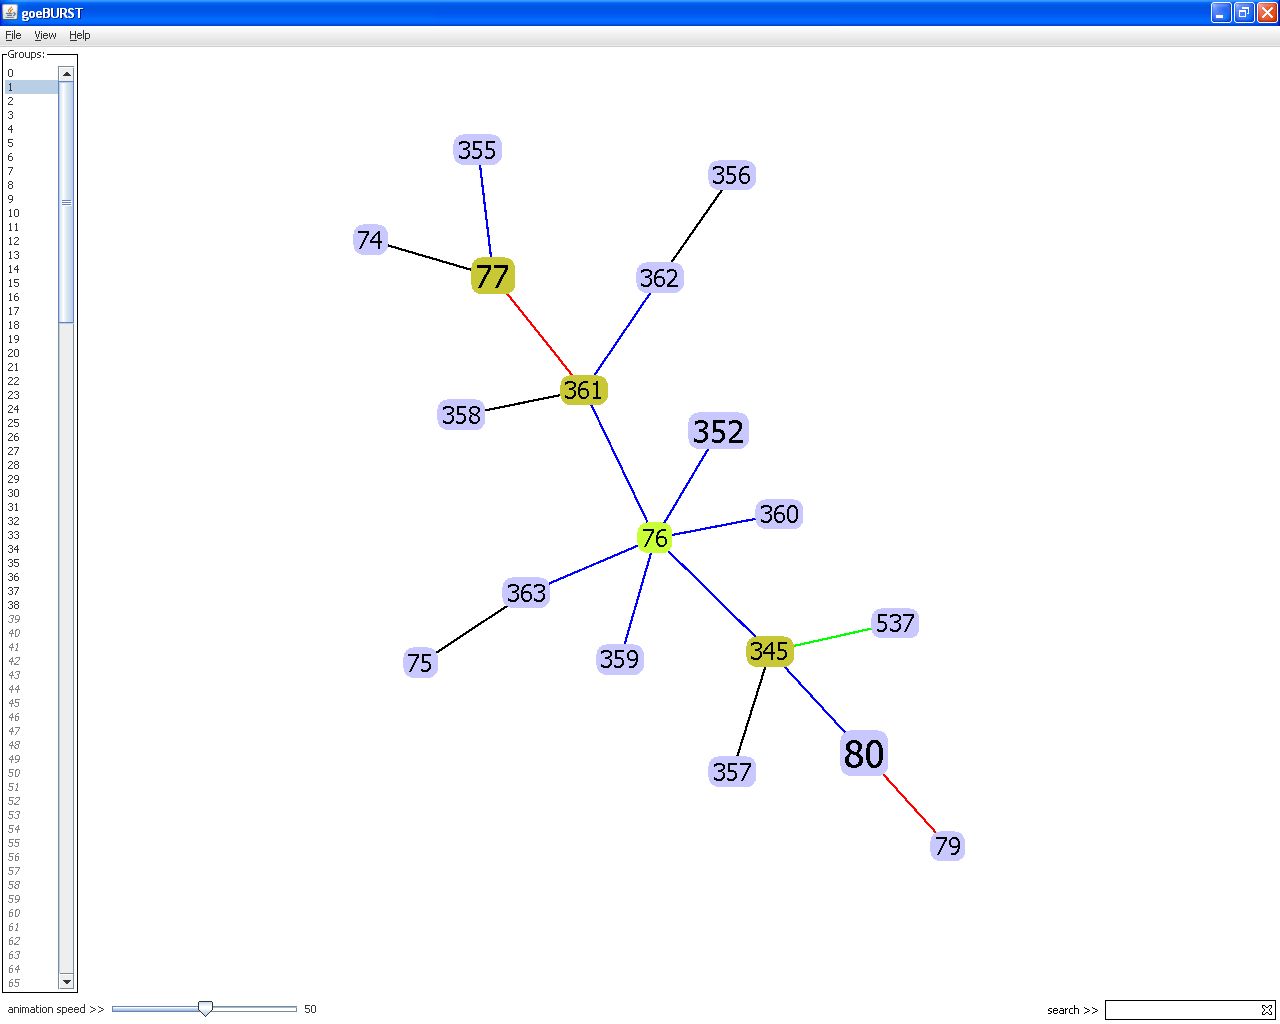
Link colors
Black - Link drawn without recourse to tiebreak rules
Blue - Link drawn using tiebreak rule 1 (number of SLVs)
Green - Link drawn using tiebreak rule 2 (number of DLVs)
Red - Link drawn using tiebreak rule 3 (number of TLVs)
Yellow - Link drawn using tiebreak rule 4 or 5 (Frequency found on the data set and ST number , respectively)
Gray - Links drawn at DLV (darker gray) or TLV (lighter gray) if the groups are constructed at DLV/TLV level
ST nodes colors
Light green - Group founder
Dark green - Sub-group founder
Light blue - Common node
Red - Selected node
If you hover with the mouse pointer above a node, the colors change highlighting the nodes more closely related to that node.
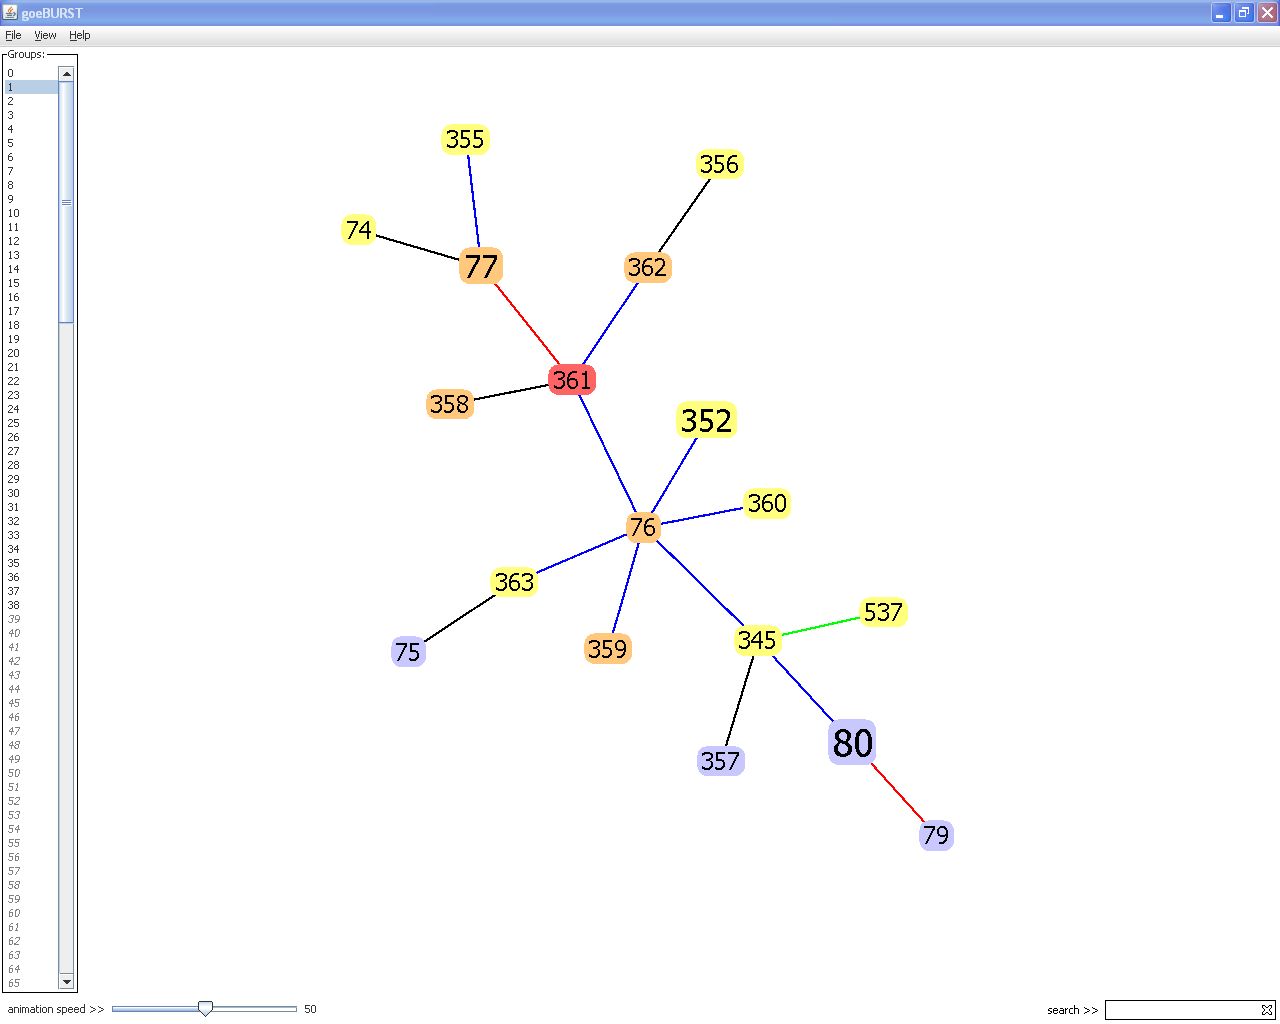
All single-locus variants (SLVs) of that particular ST are
indicated in orange and the double-locus variants (DLVs) in
yellow.
Info panel
To activate the information panel go to View > Info.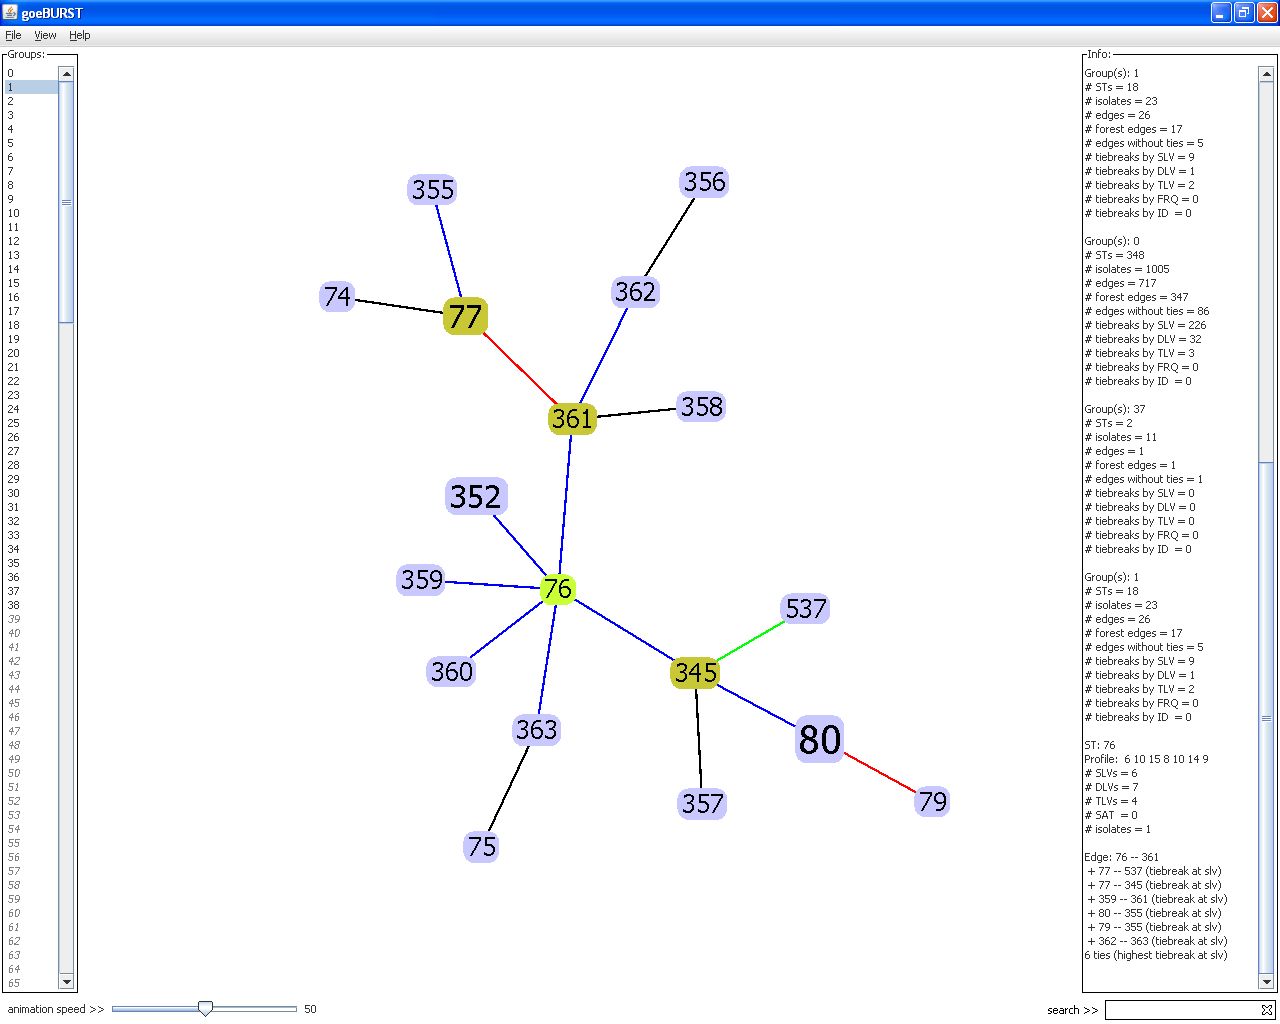
A panel will be displayed in the right hand of the main window detailing information on the several elements being displayed. The default information presented details information of the group or groups (selected by control+click on the group panel) displayed in the main window. If you click on a ST node or on a link between two STs the Info panel will show information for that node or link (see figure).
Creating groups at higher levels
If you selected an Edge level to define groups higher that SLV you have the option of joining the subgroups with links at DLV or TLV level. To activate those links go to View>High Level edges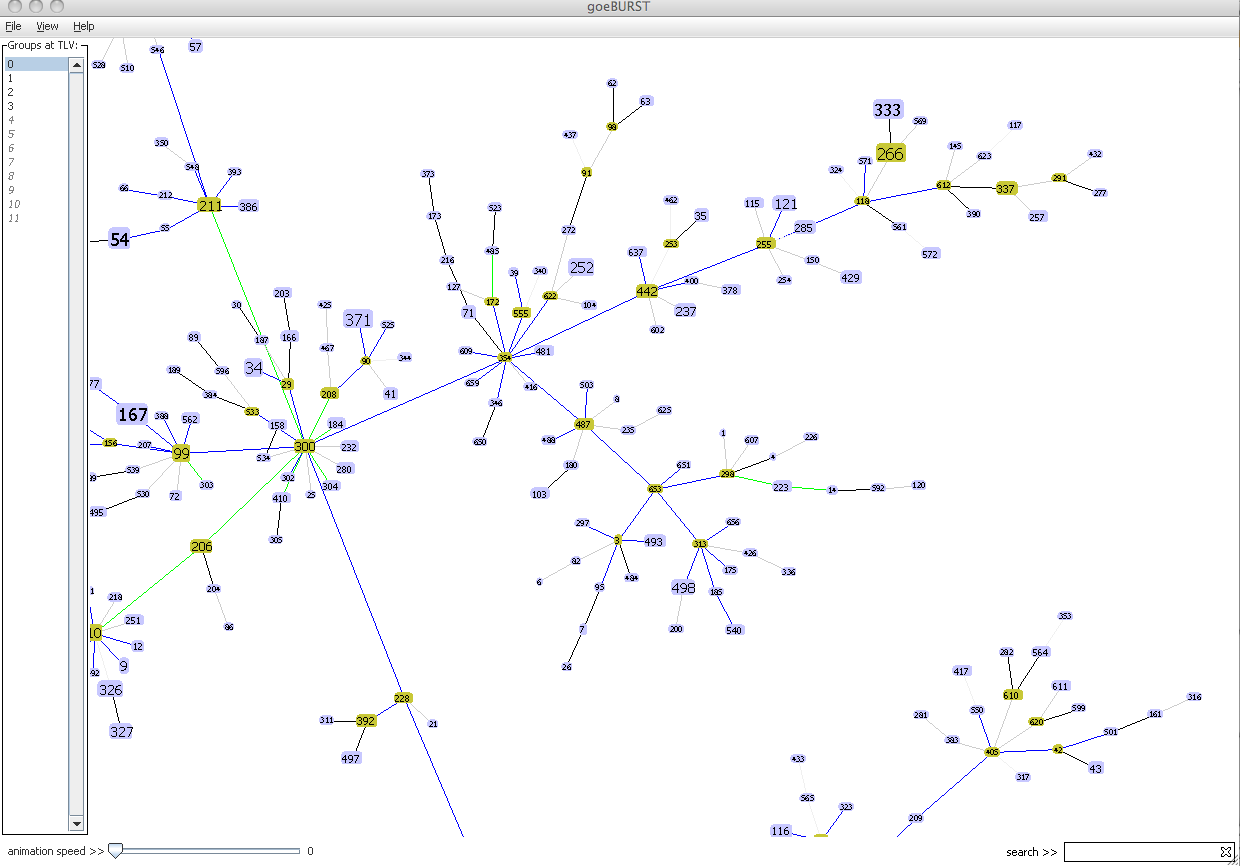
The DLV and TLV links will be in displayed as gray links (TLV links will be lighter gray than DLV links). Since these links are defined at levels higher than SLV, they won't have any link confidence color (See link colors above) assigned to them.
Highlighting data sets
You can change the color of a subset of STs. This is a useful option when you want to highlight all the isolates that share a particular characteristic and to compare diferent subsets of the entire dataset. To do this create a text file that includes a list of ST numbers that is a subset of the original dataset with the nodes presenting the characteristic of interest. Each line in that file should contain a single ST number. Then go to File > Select > Load and open this file. You will then be prompted to select the color in which the nodes present in this file will be highlighted.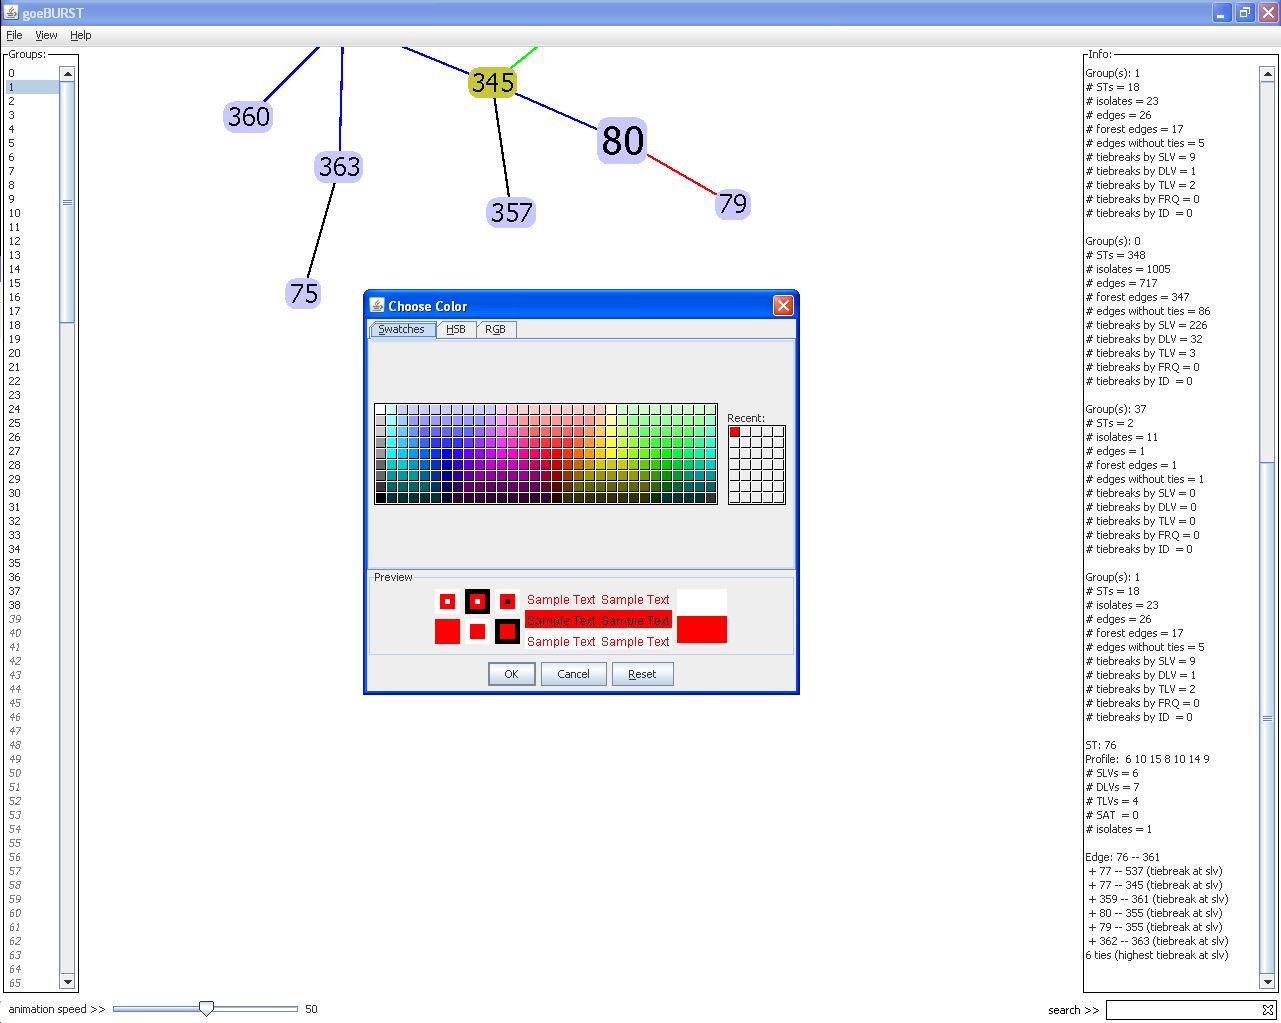
After chosing the color, the selected nodes will appear highlighted in the main window.
Change a group founder
You can change a group founder by shift+left clicking on a node and ticking the appropriate box.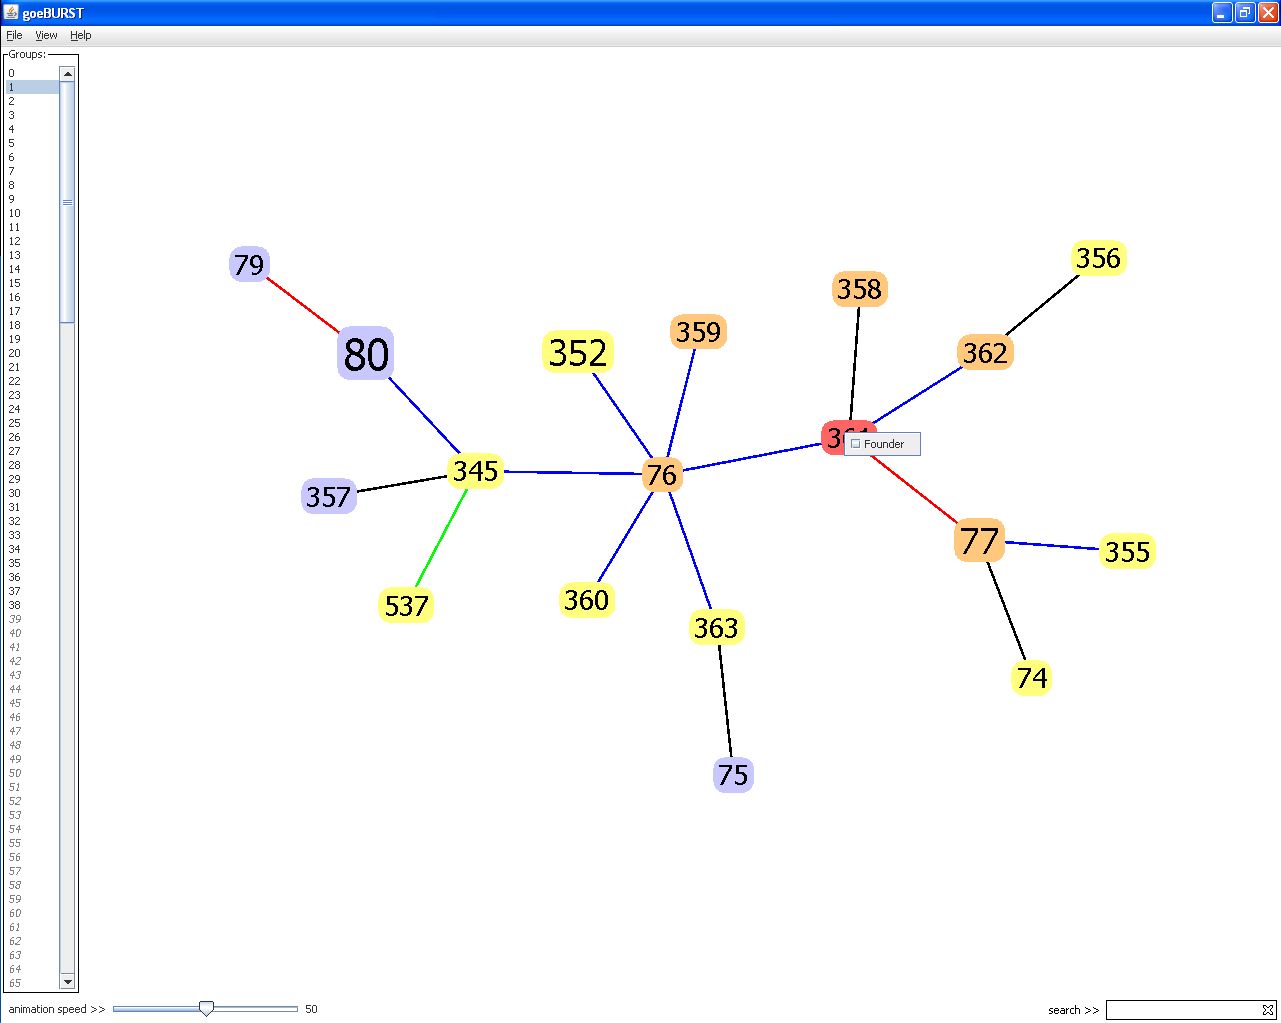
This is expected to have only a modest effect on the graph since the solution presented is already a global optimum.
